
3D Printing Cost Calculator: The 2026 Guide to Bambu Lab Profitability
Strategic financial modeling and technical analysis for the modern additive manufacturing era.
In the industrial landscape of 2026, 3D printing has transitioned from a niche prototyping tool to a primary manufacturing asset. The rapid market penetration of the Bambu Lab ecosystem has democratized high-speed production, but it has also introduced complex financial variables. For a business to thrive, “guessing” the price of a part is no longer an option. True success is built on a precise 3D printing cost calculator that accounts for every micro-expense in the production chain.
This guide deconstructs the technical and economic pillars of operating Bambu Lab machines at scale. We will explore how energy fluctuations, mechanical depreciation, and material waste management dictate your bottom line. To find your specific break-even point, professional modeling remains essential for the 2026 economic climate.
The 2026 Production Economy
Until recently, the industry was obsessed with “Print Speed.” In 2026, with Bambu Lab machines regularly hitting 500 mm/s, speed has become a commodity. The new battleground is Reliability-to-Cost ratio. A business that operates a fleet of printers must look at “Yield Efficiency.” If your 3D printing cost calculator does not account for a 3-5% failure rate, your projected margins are likely fictional.
Modern production management involves balancing “Machine Hours” against “Fixed Costs.” In 2026, we see a shift toward decentralized manufacturing where local hubs use Bambu Lab farms to fulfill orders. This requires a surgical understanding of local utility rates and labor costs to stay competitive against global shipping alternatives.
Technical Pillar: Infrastructure Selection
Choosing your hardware is the most significant Capital Expenditure (CAPEX) decision. Each model in the 2026 Bambu Lab lineup serves a distinct financial role.
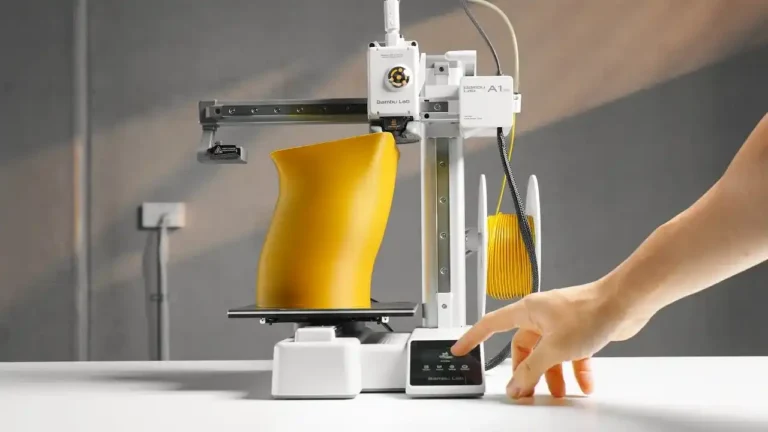
Bambu Lab X1-Carbon: The High-Margin Specialist
The X1-Carbon (X1C) remains the king of engineering-grade materials. In 2026, when printing with advanced polymers like PPA-CF or Flame Retardant (FR) filaments, the raw material cost can exceed $150 per spool. The X1C’s LiDAR-based defect detection is a “Financial Guard”—it prevents the waste of expensive materials by stopping faulty prints early. This feature alone can increase your net ROI by 12% annually in industrial settings.
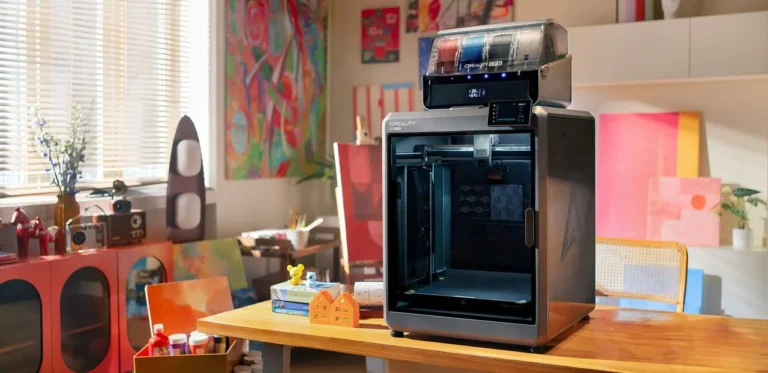
Bambu Lab P2S: Scaling the Farm
The P2S has become the 2026 workhorse for Small to Medium Enterprises (SMEs). By focusing on core performance without the expensive sensors of the X1C, the P2S provides a much faster amortization cycle for standard materials like PLA, PETG, and ASA. When scaling to 20 or 50 units, the P2S is the optimal unit for your financial simulations.
Mastering OPEX: The Invisible Margin Killers
Operational Expenses (OPEX) often go uncalculated by hobbyists, but for a 2026 enterprise, they are the difference between profit and bankruptcy.
1. Dynamic Energy Load
With global energy prices fluctuating, the power draw of a printer is no longer negligible. A Bambu Lab unit heating a bed to 110°C for engineering plastics can consume significant kilowatt-hours. In 2026, smart farms use energy-aware scheduling. Integrating real-time utility rates into cost calculations is now a standard practice for professional service bureaus.
2. Mechanical Depreciation Lifecycle
High-speed movement (20,000 mm/s² acceleration) puts immense stress on belts, nozzles, and carbon rods. In 2026, we allocate a “Maintenance Tax” of roughly $0.08 to $0.15 per print hour. Ignoring this leads to a sudden CAPEX shock when the machine requires a full overhaul at 3,000 hours.
AMS Yield & Material Optimization
The Bambu Lab AMS (Automatic Material System) is a miracle for multi-color and multi-material parts, but it is also a potential source of extreme waste. “Purge waste” or “poop” generated during filament swaps can account for up to 30% of your material cost on complex jobs. Professional 2026 operators utilize “Flush into Infill” and “Support Interface” strategies to reclaim this cost. A part that costs $10 in filament on a single-color machine might cost $18 on an AMS system; your accounting must be sophisticated enough to detect this delta.
Strategic Pricing & ROI Modeling
Setting your price in 2026 requires a data-first approach. We recommend a four-pillar pricing strategy:
- Base Material: (Part Weight + Support + Purge) x Cost per Gram.
- Machine Hourly Rate: Energy + Depreciation + Maintenance.
- Labor Overhead: File prep, post-processing, and packaging.
- The Innovation Premium: Markup for technical expertise and urgency.
By using a dedicated modeling approach, you can ensure that your markup covers not just the plastic, but the future replacement of the machine itself.
2026 Global ROI Benchmarks
How does your farm compare to global industry leaders? Here are the target metrics for 2026:
| Metric | Target Goal | ROI Impact |
|---|---|---|
| Successful Print Rate | 97.5% + | Critical |
| Machine Utilization | 70% (16 hrs/day) | Very High |
| Break-Even Period | 4 – 8 Months | High |